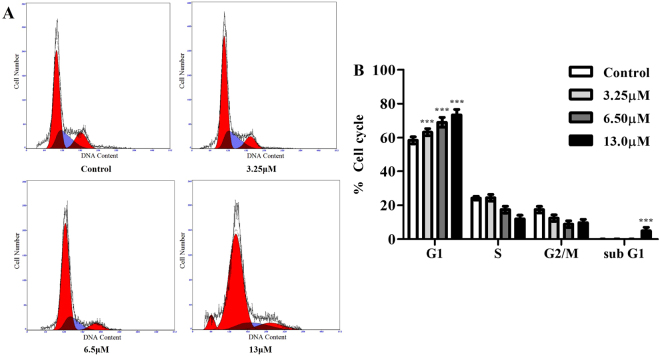
Figure 2.
Flow cytometry analysis histograms of G0/G1-phase arrest in 24 h M22 treated A549 cells. (A) The G0/G1 peak increases with corresponding decrease in S and G2 peak in dose dependent manner. M22 treated cells at 13 μM showing an increased sub G1 peak indicating apoptosis. (B) The percent of cells in different phases of cell cycle are represented by bar diagram. Data are from 3 independent experiments and analyzed by one-way analysis of variance, ***p < 0.001 compared to control. PI fluorescence was measured using a flow cytometer with FL-2 filter.

