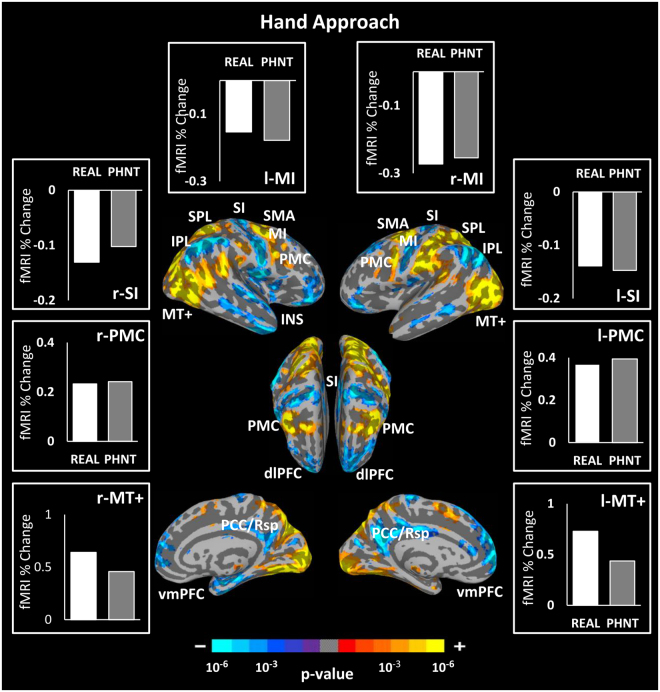
Figure 4.
Brain response group map of hand approach events. Both groups revealed similar brain responses to hand approach events including significant signal increase in the PMC, SMA, MT+, SPL and significant signal decreases in the MI, SI, vmPFC, PCC and IPL. Bar figures represent the mean of the group activations extracted from an ROI (4 mm diameter sphere) around the activation peak in the corresponding brain area. n.b. IPL, inferior parietal lobule; SI, primary somatosensory cortex; MT+, middle temporal complex; PCC/Rsp, posterior cingulate cortex/retrosplenial cortex; dlPFC, dorsolateral prefrontal cortex; ACC, anterior cingulate cortex; vmPFC, ventromedial prefrontal cortex; SPL, superior parietal lobule; PMC, premotor cortex; SMA, supplementary motor area; INS, insular cortex.

