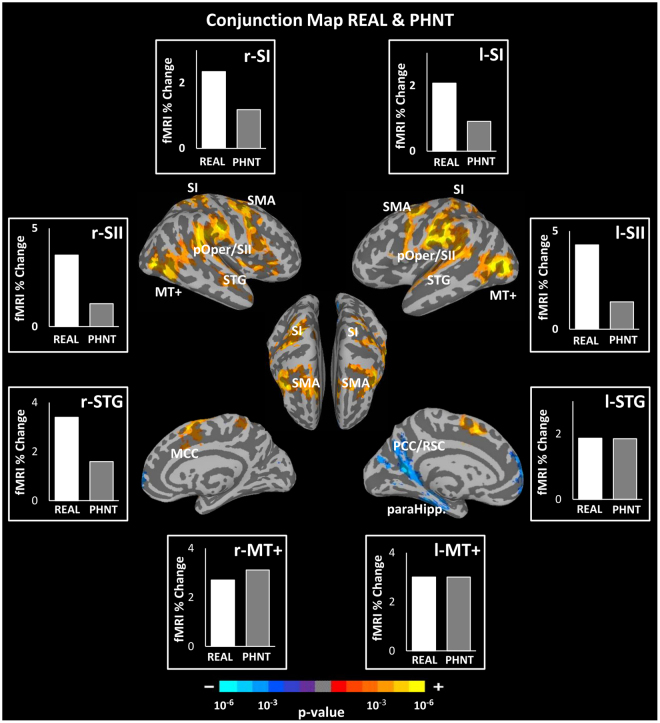
Figure 6.
Conjunction map between real (REAL) and phantom (PHNT) acupuncture stimulation. Both conditions revealed significant activation in several brain regions: bilateral MI, SI, pOper/SII, PMC, STG, MT+, TPJ, and MCC, as well as the right mIns and aIns. Deactivation in the left vmPFC, PCC/Rsp, precuneus, and paraHipp was also found. Bar figures represent the mean of the group activation extracted from an ROI (4 mm diameter sphere) around the activation peak in the corresponding brain area.

