. 2018 Jan 11;15:E05. doi: 10.5888/pcd15.170152

Figure 1.

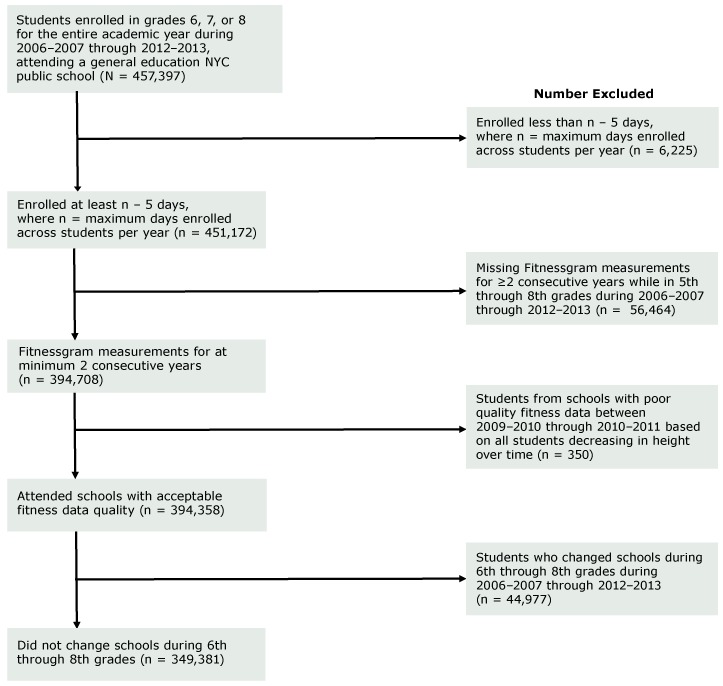
Student selection started with students attending a general education NYC public school enrolled in grades 6, 7, or 8 for the entire academic year during 2006–2007 through 2012–2013 (N = 457,397). Excluded were 6,225 students enrolled less than n − 5 days, where n = maximum days enrolled across students per year, leaving 451,172 students. Students were also excluded if Fitnessgram measurements were missing for 2 or more consecutive years while in 5th through 8th grades during 2006–2007 through 2012–2013 (n = 56,464), leaving 394,708 students with Fitnessgram measurements for a minimum of 2 consecutive years. Next, students from schools with poor-quality fitness data during 2009–2010 through 2010–2011 were excluded based on all students decreasing in height over time (n = 350), leaving 394,358 students with acceptable fitness data quality. Also excluded were students who changed schools during 6th through 8th grades (n = 44,977). After the above exclusions, the final sample included 349,381 unique 6th- through 8th-grade students.

Sample selection flowchart for the association of fitness and absenteeism in New York City (NYC) public middle school students, 2006–2007 through 2012–2013.