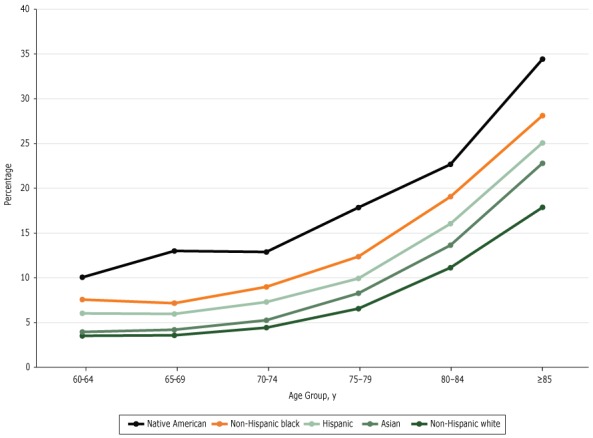
Figure 1.

Predicted probability of reporting cognitive impairment, by age group. Data are from the National Health Interview Survey, 1997–2015.
| Age Group, y | Non-Hispanic White, % | Non-Hispanic Black, % | Native American, % | Hispanic, % | Asian American, % |
|---|---|---|---|---|---|
| 60–64 | 3.5 | 7.6 | 10.1 | 6.0 | 4.0 |
| 65–69 | 3.6 | 7.2 | 13.0 | 6.0 | 4.2 |
| 70–74 | 4.4 | 9.0 | 12.9 | 7.3 | 5.3 |
| 75–79 | 6.6 | 12.4 | 17.9 | 9.9 | 8.3 |
| 80–84 | 11.1 | 19.1 | 22.7 | 16.0 | 13.6 |
| ≥85 | 17.9 | 28.1 | 34.4 | 25.1 | 22.8 |
