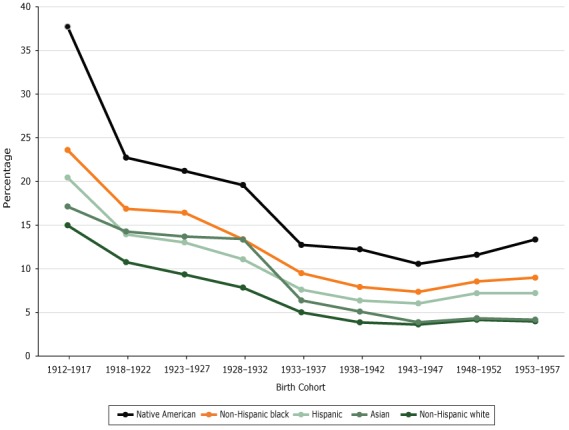
Figure 2.

Predicted probability of reporting cognitive impairment, by birth cohort. Data are from the National Health Interview Survey, 1997–2015.
| Birth Cohort | Non-Hispanic White | Non-Hispanic Black | Native American | Hispanic | Asian |
|---|---|---|---|---|---|
| 1912–1917 | 15.0 | 23.6 | 37.7 | 20.4 | 17.1 |
| 1918–1922 | 10.8 | 16.9 | 22.7 | 13.9 | 14.3 |
| 1923–1927 | 9.3 | 16.4 | 21.2 | 13.0 | 13.7 |
| 1928–1932 | 7.8 | 13.4 | 19.6 | 11.1 | 13.4 |
| 1933–1937 | 5.0 | 9.5 | 12.7 | 7.6 | 6.4 |
| 1938–1942 | 3.9 | 7.9 | 12.2 | 6.4 | 5.1 |
| 1943–1947 | 3.6 | 7.4 | 10.6 | 6.0 | 3.9 |
| 1948–1952 | 4.1 | 8.5 | 11.6 | 7.2 | 4.3 |
| 1953–1957 | 4.0 | 9.0 | 13.3 | 7.2 | 4.2 |
