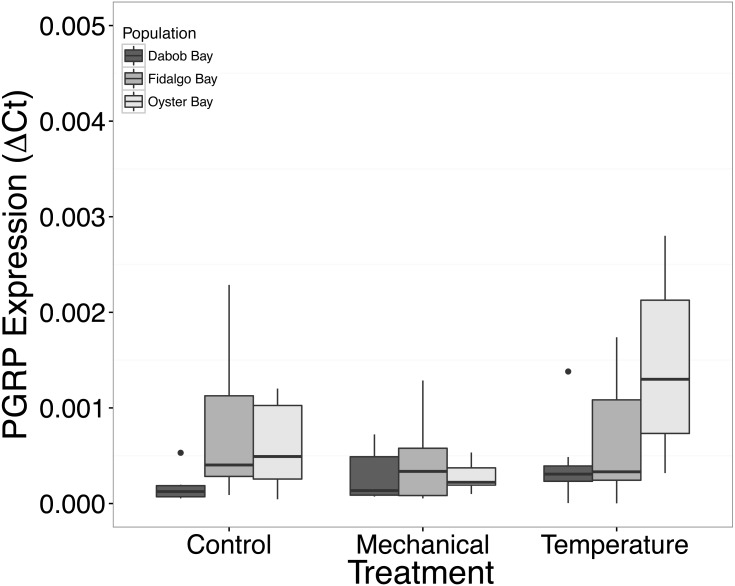
Figure 6. Expression of PGRP mRNA.
No statistical difference observed between treatments, nor between populations. Median ΔCt indicated by line in middle of box plot. Shaded boxes are 2nd and 3rd quartile groups. Lines are 1st and 3rd quartiles. Dots indicate outside values. No statistical differences (p > 0.05) were observed within populations between treatments (n = 8 animals per treatment), between populations (n = 24 animals per population), or between treatments (n = 24 animals per treatment).

