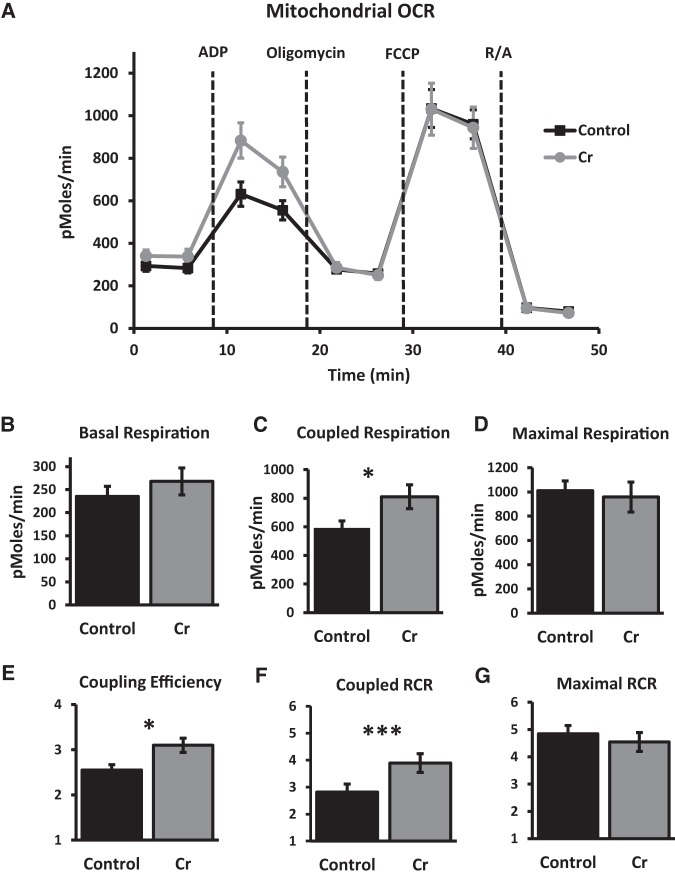
Figure 4.
OCR in mitochondria isolated from the hippocampus after MWM training in control and Cr-fed mice. (A) Kinetics graphing indicating real-time OCR at baseline and after addition of substrates ADP, oligomycin, FCCP, and rotenone/antimycin (R/A) in 10 µg of mitochondrial protein per well. (B) Basal respiration, (C) coupled respiration, and (D) maximal respiration (mean ± SEM) were calculated after subtracting nonmitochondrial respiration (after R/A) and compared between control and Cr-fed mice. (E) Coupling efficiency was calculated by dividing coupled respiration (after addition of ADP) by basal respiration. (F) Coupled RCR was calculated by dividing coupled respiration rates (after ADP) by OCR after oligomycin. (G) Maximal RCR was calculated by dividing maximal respiration rates (after FCCP) by OCR after oligomycin. Student's t-test; n = 9–10 wells per group; (*) P < 0.05; (***) P < 0.001.

