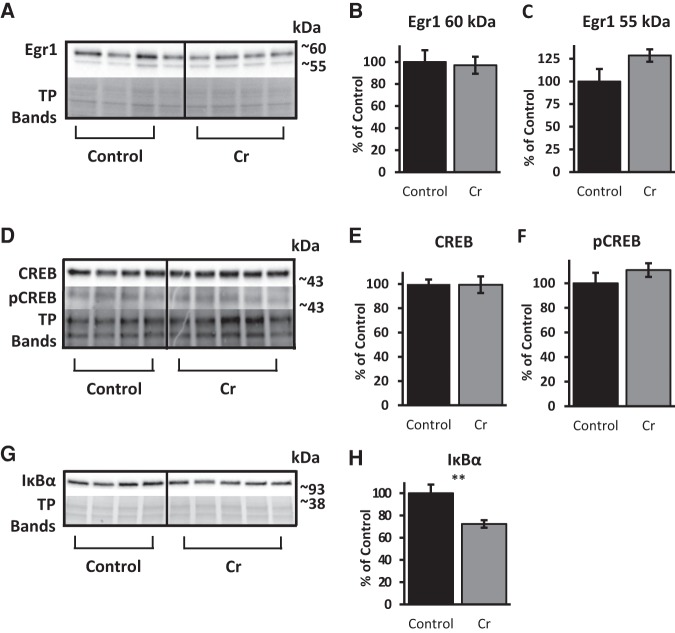
Figure 5.
Relative levels of transcription factors and related proteins in the hippocampus of MWM-trained mice as a function of diet. Representative Western blots detecting (A) Egr1, (D) CREB, and (G) IκBα. Total protein bands were visualized with Ponceau S staining (in A and G) or with TGX Stain-Free gels (Bio-Rad) in D; representative bands shown to indicate loading across samples. Samples from each group were immunoblotted on the same gels for comparison. Bar graphs depict densitometry values of (B) ∼60 kDa (C) and ∼55 kDa bands detected with anti-Egr1 as well as (E) CREB and (H) IκBα after normalizing to total protein bands (expressed as the percentage change from control means of 100% ±SEM. (F) Bar graph depicting densitometry values of pCREB, normalized to total CREB band (% change from control mean set at 100% ±SEM). Student's t-test; n = 4–5; (**) P ≤ 0.01.

