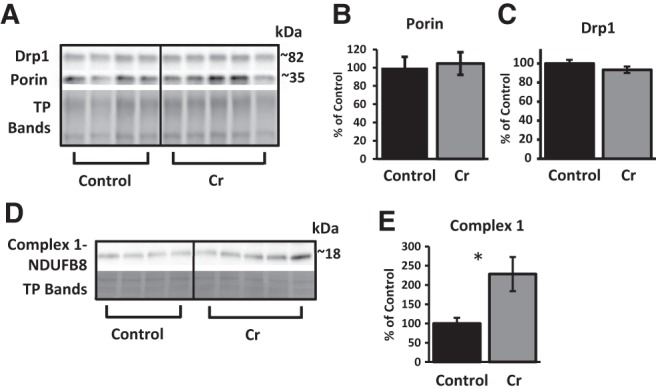
Figure 7.

Relative levels of mitochondrial proteins in the hippocampus of MWM-trained mice as a function of diet. (A) Representative Western blot detecting Drp1, porin, and total protein (with TGX Stain-Free gels; representative bands from total proteins shown to indicate loading across samples). Bar graphs depict densitometry values of (B) porin and (C) Drp1 after normalizing to total protein bands and expressed as the percentage change from control means (100%) ±SEM. (D) Representative Western blot and (E) bar graph (percent change from control mean of 100% ±SEM) depicting levels of NDUFB8, a subunit of the electron-transport chain protein Complex I, in trained mice after normalizing to total protein (TP; Ponceau S staining). Student's t-test; n = 4–5; (*) P < 0.05.
