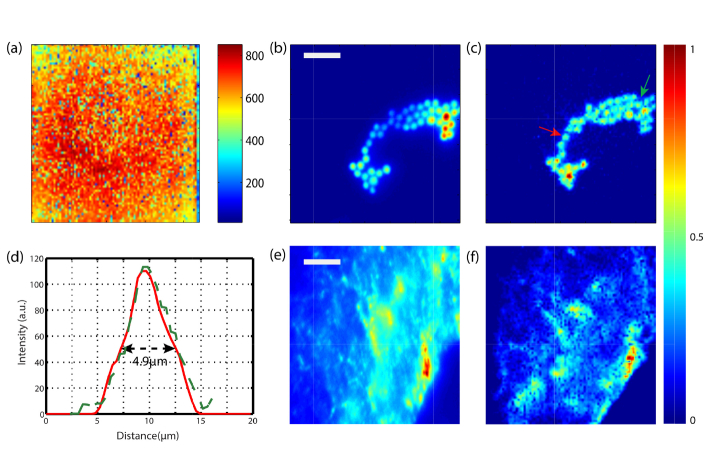
Fig. 5.
Demonstration of the single-fiber endoscope. (a) Colormap of the peak-to-brakground ratio of each focus created at the distal tip of the fiber. (b) Sample of 4µm fluorescence beads imaged with fluorescence widefield microscope. (c) The same sample imaged with the MMF scanning endoscope. (d) Line scan of two beads pointed by the red and green arrows in (c). (e) A brain monkey slice labeled with Cy3 imaged using a fluorescence widefield microscope and (f) using the MMF scanning endoscope. Scale bar is 20µm

