
Fig. 2.
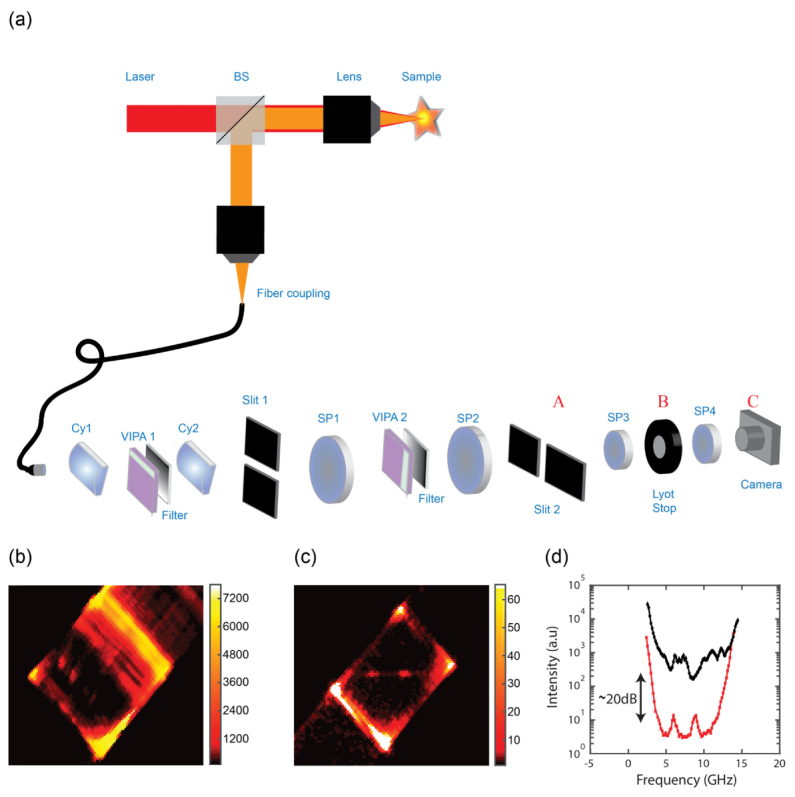
Setup and quantification of the coronagraphy effect: (a) An expanded laser beam (red path) is focused into a sample by a 0.7 NA lens (Olympus, LUCPLFLN 60X). Back scattered light (orange path) is collected in an epi-detection configuration and coupled into a single mode fiber. The collimated beam exiting the fiber is focused by a cylindrical lens (Cy1) into the first VIPA; the pattern is gradually filtered and focused onto a vertical slit (slit 1) placed in the focal plane of a second cylindrical lens (Cy2). Next, the pattern is imaged by a 4-f imaging system and through a second VIPA onto a horizontal slit (slit 2). The final plane of the spectrometer (plane A) is imaged onto the camera (plane C) via another 4-f imaging system with a spatial filter (Lyot stop) located in the Fourier plane (plane B). (b, c) Brillouin signal from the interface between water and a plastic cuvette, recorded with 27 mW laser power at the sample and 100 ms integration time. The back reflection from the interface was measured to be ~0.7%. (b) With the Lyot stop open the background overcomes the Brillouin signal. (c) By closing the Lyot stop, a clean Brillouin signal can be observed. (d) Average line plot of the signal width in b and c, demonstrating a ~20 dB noise reduction obtained by the Lyot stop.