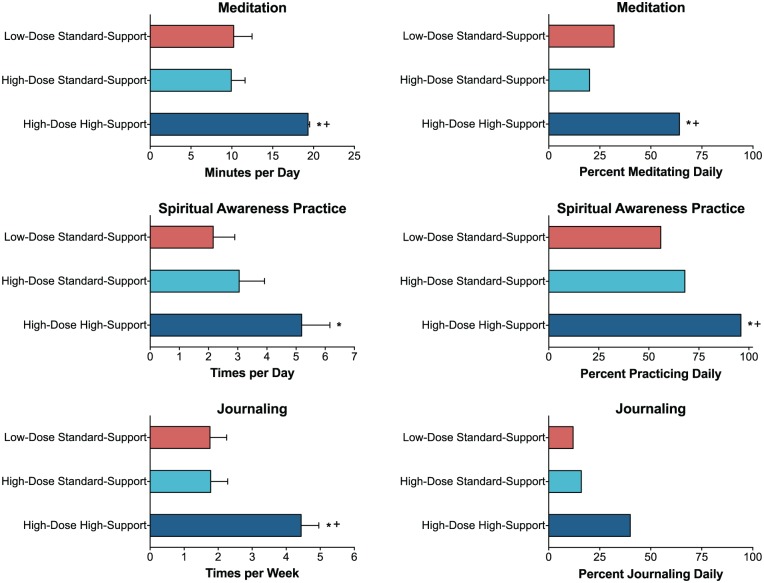
Figure 4.
Spiritual practices at 6 months (from Table 4).
Data, which were obtained at the 6-month follow-up, show retrospective ratings for the past 4 months. Bars displaying rate data show means; brackets show 1 SEM (n=25). Meditation rate data are minutes per day for all days. Bars displaying proportion data show the percentage of the group (n=25) reporting the practice during the indicated time interval. * indicates a significant difference from the Low-Dose Standard-Support group; + indicates a significant difference between the High-Dose High-Support group and the High-Dose Standard-Support group (Planned comparisons, p<0.05).

