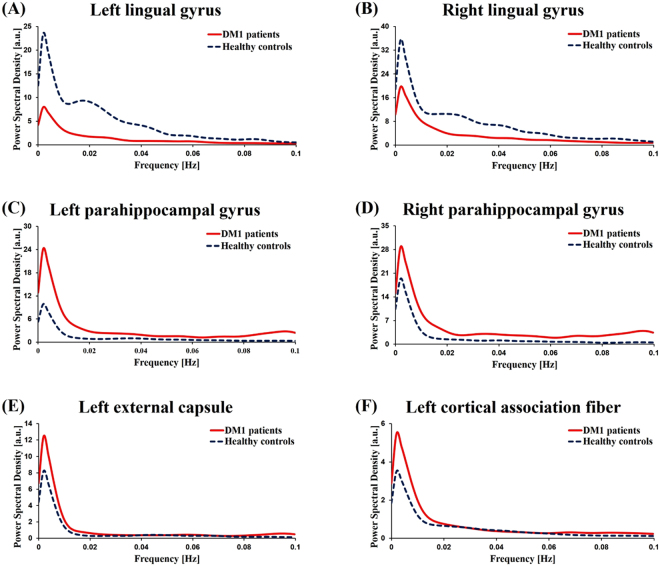
Figure 3.
Group mean power spectral density of left lingual gyrus (A), right lingual gyrus (B), left parahippocampal gyrus (C), right parahippocampal gyrus (D), left external capsule (E), left cortical association fiber (F). In the patients with DM1, the PSDs in the bilateral parahippocampal gyrus, left external capsule and left cortical association fiber were significantly higher than the PSDs of healthy controls (P < 0.05). The PSDs in the bilateral lingual gyrus were significantly lower than the PSDs of healthy controls (P < 0.05).

