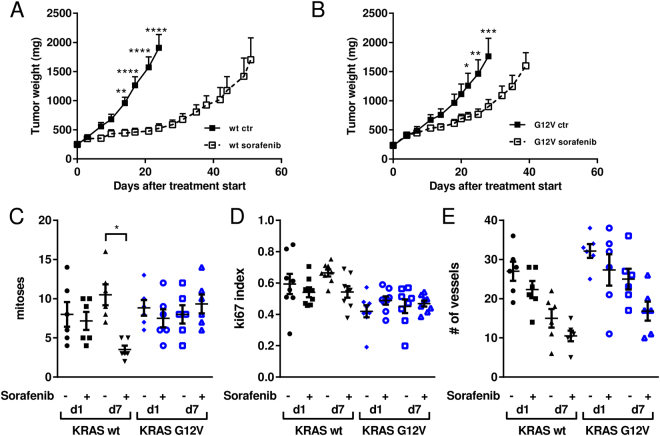
Figure 2.
(A) Antitumor effects of 100 mg/kg of sorafenib daily in NCI-H1299 KRAS wt murine xenografts. *p < 0.05, **p < 0.01, ***p < 0.001. (B) Antitumor effects of 100 mg/kg of sorafenib daily in NCI-H1299 KRAS G12V murine xenografts. ****p < 0.0001 (C) Number of mitoses in six samples per group on days 1 and 7 after the last sorafenib dose in wt and G12V murine xenografts. *p < 0.05. (D) Ki-67 index in six samples per group on days 1 and 7 after the last sorafenib dose in wt and G12V murine xenografts. (E) Number of vessels in six samples per group on days 1 and 7 after the last sorafenib dose in wt and G12V murine xenografts.

