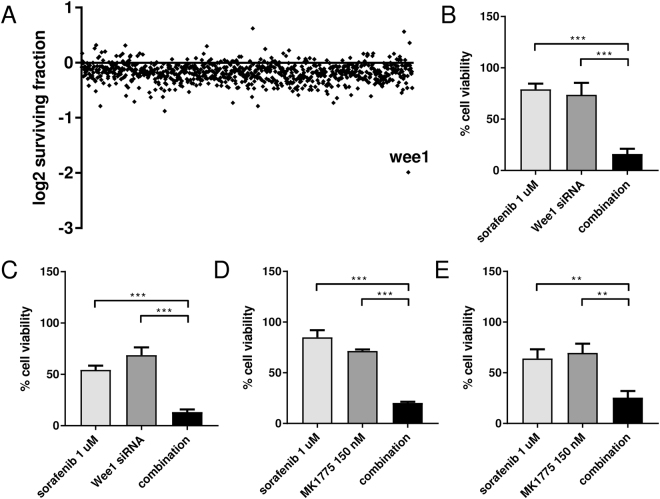
Figure 3.
(A) Sensitivity of KRAS G12V cells treated with sorafenib 1 uM and transfected with each siRNA pool. The log2 of the surviving fraction is shown. (B) Response of G12V cells to sorafenib (1 uM), Wee1 esiRNA (30 nM) or the combination detected by MTS assay. The average of three independent experiments and SD are shown. ***p < 0.001. (C) Response of G12C cells to sorafenib (1 uM), Wee1 esiRNA (30 nM) or the combination detected by MTS assay. The average of three independent experiments and SD are shown. ***p < 0.001. (D) Response of G12V cells to sorafenib (1 uM), MK1775 (150 nM) or the combination detected by MTS assay. The average of three independent experiments and SD are shown. ***p < 0.001. (E) Response of G12C cells to sorafenib (1 uM), MK1775 (150 nM) or the combination detected by MTS assay. The average of three independent experiments and SD are shown. **p < 0.01.

