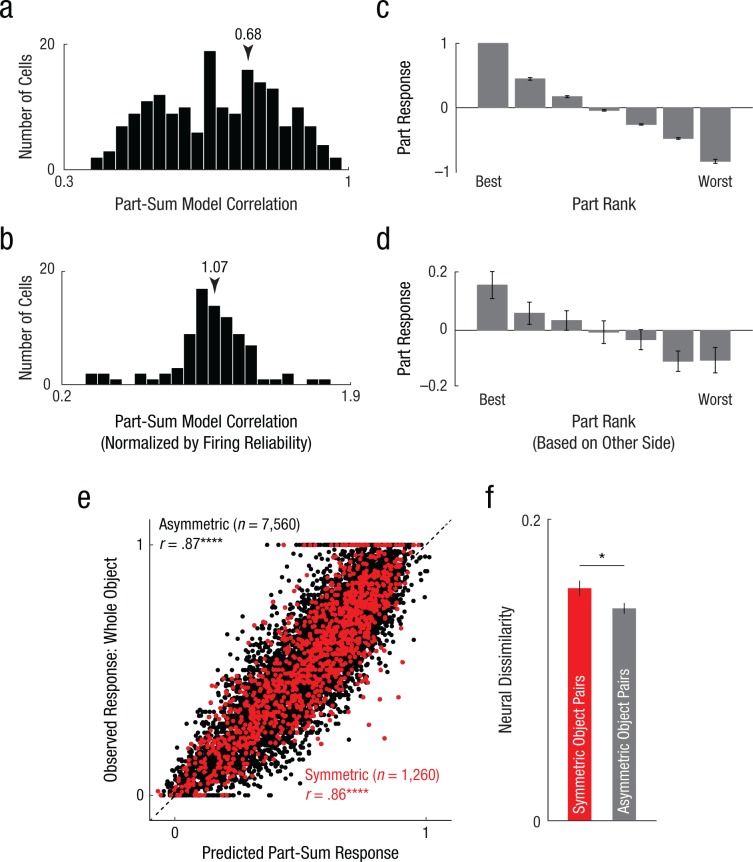
Fig. 2.
Part summation in symmetric and asymmetric objects in monkey inferior temporal (IT) neurons. The histogram in (a) shows results across neurons for the correlation between the observed response and the response predicted by the part-sum model. The response of each neuron was modeled as a sum of part activations on each side. To estimate the degree to which the model captures the systematic variation in firing for each neuron (b), we fitted the part-sum model to odd-numbered trials, calculated its predictions on even-numbered trials, and divided the resulting model correlation by the observed correlation between odd and even trials. The plot depicts the normalized model correlation calculated in this manner for all neurons with significant split-half correlations (n = 87). The arrows in (a) and (b) indicate the average correlation coefficient. The graph in (c) shows part response (normalized to the maximum) for left or right parts for neurons showing at least one main or interaction effect (n = 128). The graph in (d) shows normalized part response for the right parts arranged according to the left-part preference (and vice versa). Error bars in (c) and (d) show ±1 SEM. The scatterplot (e) shows the normalized observed response plotted against the response predicted by part summation across all objects and neurons for asymmetric objects and symmetric objects. The dashed line represents the least-square fit. Asterisks indicate significant correlations (****p < .00005). The bar graph in (f) shows the mean neural dissimilarity for symmetric object pairs and equivalent asymmetric object pairs. The asterisk indicates a significant difference between pair types (*p < .05). Error bars represent ±1 SEM calculated on neurons (n = 180).

