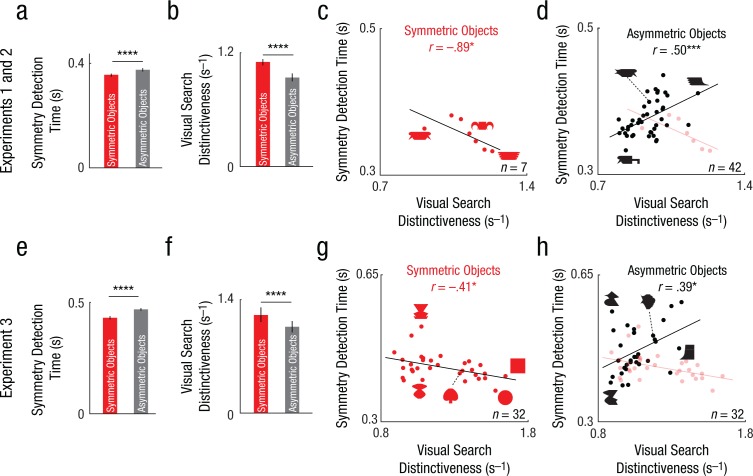
Fig. 5.
Distinctiveness as a predictor of symmetry perception in Experiments 1 through 3. Average response time during the symmetry-judgment task (a) is shown as a function of object type in Experiment 2. Average distinctiveness in visual search (b) is shown as a function of object type in Experiment 1. The scatterplots (with best-fitting regression lines) show the relation between symmetry detection time and visual search distinctiveness, separately for (c) symmetric objects and (d) asymmetric objects in Experiment 2. In (d), results for symmetric objects are overlaid faintly for comparison. Average response time during the symmetry-judgment task (e) and average distinctiveness in visual search (f) are shown as a function of object type in Experiment 3. The scatterplots (with best-fitting regression lines) show the relation between symmetry detection time and visual search distinctiveness, separately for (g) symmetric objects and (h) asymmetric objects in Experiment 3. In (h), results for symmetric objects are overlaid faintly. In the bar graphs, error bars represent ±1 SEM across objects, and asterisks indicate significant differences between object pairs (****p < .00005). In the scatterplots, asterisks indicate significant correlations (*p < .05, ***p < .0005).

