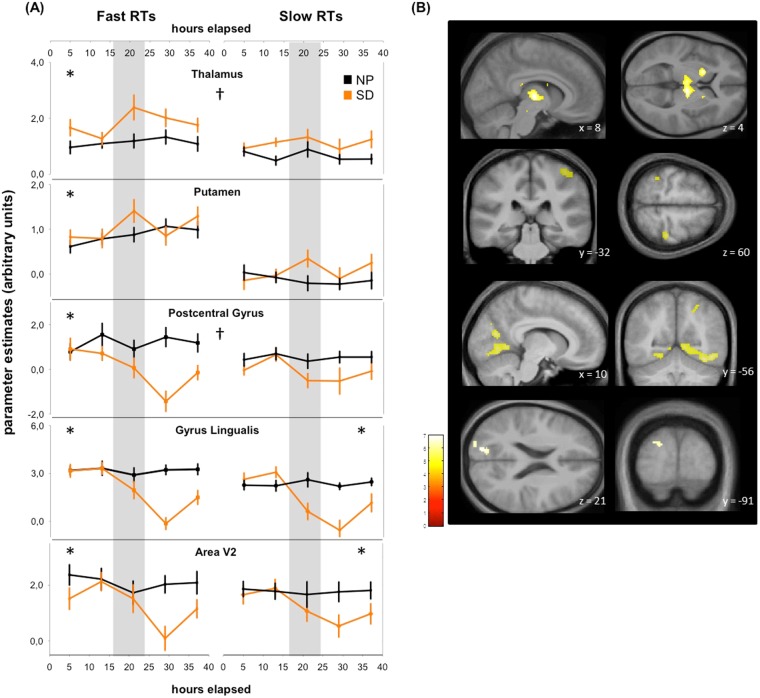
Figure 2.
Time course of brain activation during both conditions underlying fast and slow RTs. (A) Parameter estimates of brain activity time courses during SD (orange lines), NP (black lines) for fast RTs (left panels) and slow RTs (right panels). Grey area covers the biological night (16 to 24 h awake). *Areas significantly following the temporal profile of subjective sleepiness during SD; †significant difference between speed ranges. (B) Activity overlay on population mean structural image for corresponding brain areas, p < 0.001 uncorrected display for illustration.

