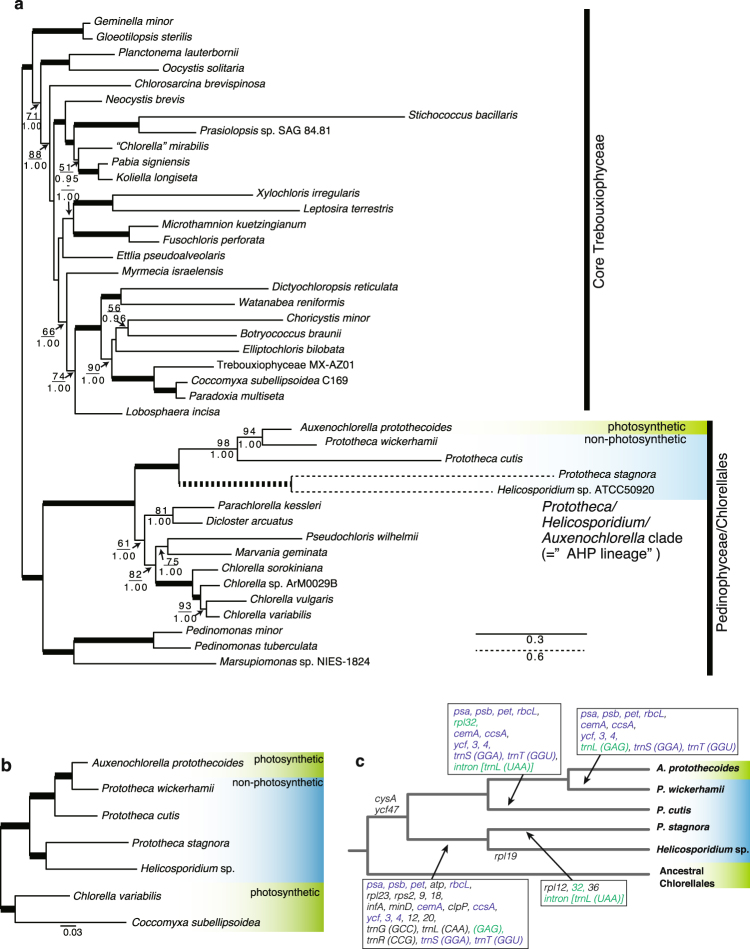
Figure 2.
Phylogenetic tree and the evolutionary scenario of the plastid gene losses in Chlorellales. (a) Maximum Likelihood (ML) tree constructed using 38 plastid-encoded proteins. Bootstrap support (BP) is indicated above the lines, and Bayesian posterior probability (BPP) is indicated below the lines. BP <50 or BPP <0.95 are not shown. Bold lines represent 100% BP and 1.00 BPP. The dotted branches are shown in half-length. (b) ML tree of 58 nucleus-encoded proteins. All the nodes were supported with 100% BP. (c) Evolutionary scenario of gene losses in P. wickerhamii, P. cutis, P. stagnora, and Helicosporidium sp. Eliminated plastid genes are indicated on the tree. Genes shown in green and blue have independently disappeared two and three times in the AHP lineage. Loss of group-I intron is presented by intron [trnL(UAA)].

