Figure 5.
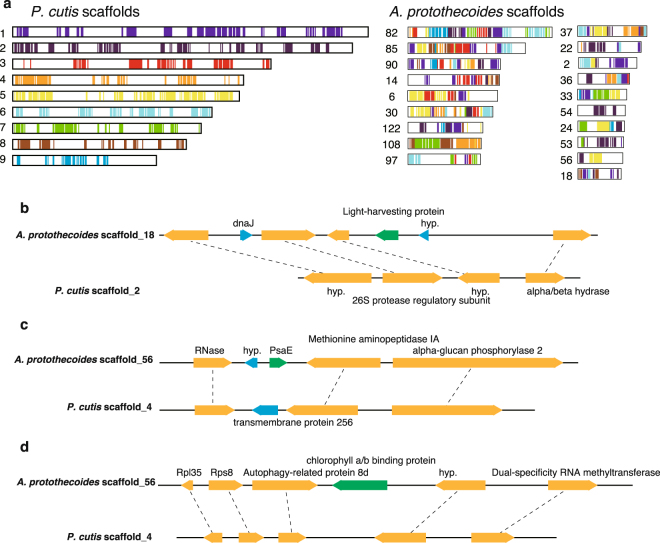
Synteny analysis of the nuclear genomes between P. cutis and A. protothecoides. (a) Syntenic regions between P. cutis and A. protothecoides nuclear genomes are indicated by coloured lines. Numbers beside the scheme represent a scaffold number. (b–d) Syntenic regions including photosynthesis-related genes (green) in A. protothecoides. Homologous genes (orange) between P. cutis and A. protothecoides are connected by dotted lines.

