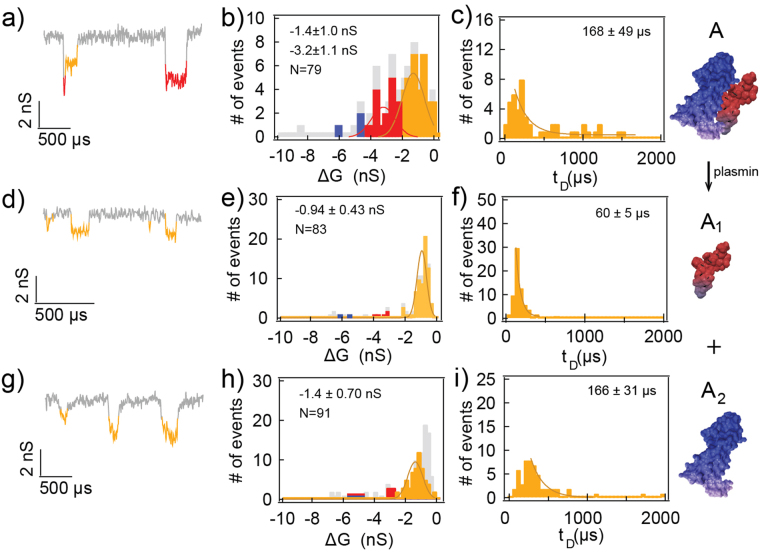
Figure 4.
Plasmin-catalyst VEGF cleavage experiment. Cartoons represent the VEGF in native state (top panel), and upon reduction with plasmin, which results in positively charged VEGF111–165 domain (middle panel) and negatively charged VEGF1–110 domain (bottom panel). (a,b) Representative events and the amplitude histogram of 20 nM VEGF at pH 7.2. Orange and red represent group A and B, respectively. (c) The dwell time histogram of group A events, tail fit by an exponential function to obtain the characteristic dwell time. (d,e) Translocation events after 15 min of adding plasmin. (f) The dwell time histogram of group A1 events. (g,h) Translocations were also observed under a positive bias. (i) The dwell time histogram of group A2 events.

