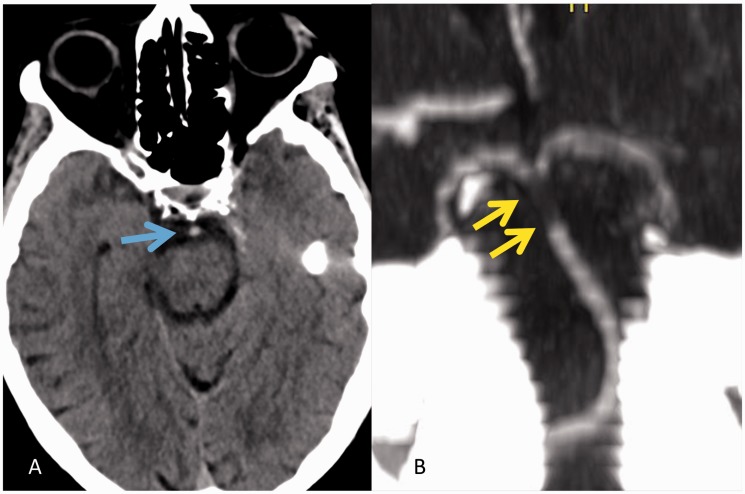
Figure 3.
Non-enhanced head CT (a) demonstrates a hyperdense basilar artery (blue arrow), which in our series was highly predictive of an acute occlusion. Thin-MIP CT angiography (b) image confirms the filling defect in the distal basilar artery (yellow arrow). CT: computed tomography; MIP CT: maximum intensity projection.

