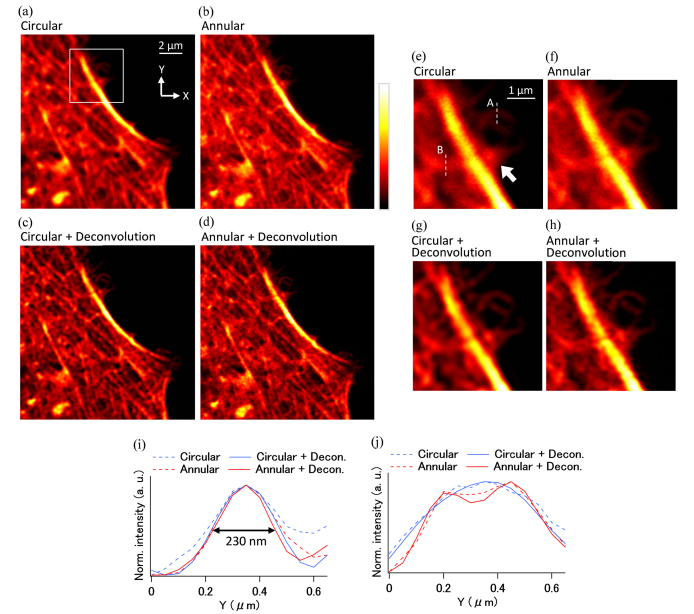
Fig. 4.
Imaging results of HeLa cells (300 × 300 pixels, 0.05 µm/pixel) (a)–(d) Images observed using circular illumination, annular illumination, a deconvolution image of circular illumination, and a deconvolution image of annular illumination, respectively. (e)–(h) Expanded images (91 × 91 pixels) of the area indicated by the small box in (a). (i, j) Normalized line profiles of the position shown by the dashed line A and B in (e), respectively.

