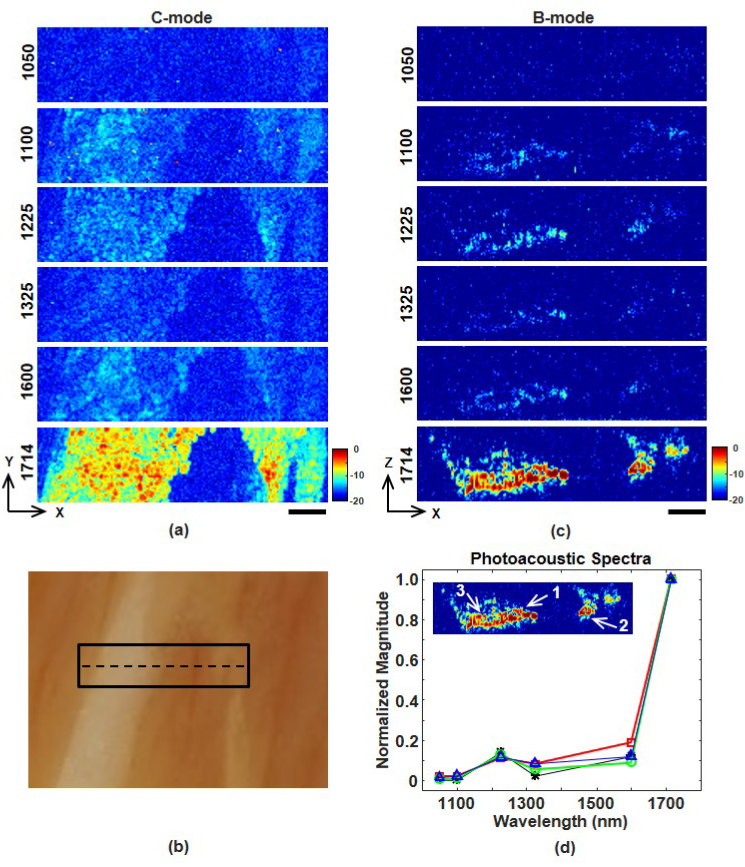
Fig. 4.
(a) Multispectral en face PAM images of a thin slice of beef embedded in clear gelatin. The scale bar represents 500 μm. (b) Photograph of the beef sample. The solid rectangle outlines the C-mode region imaged by OR-PAM. (c) B-mode image slices along the dashed black line in Fig. 4(b). The scale bar represents 500 μm. (d) Photoacoustic spectra measured at three locations (see inset) within the fatty portion of the beef sample. Locations 1, 2, and 3 correspond to red squares, green circles, and blue triangles, respectively. Black asterisks are the spectrum from the simple theoretical model.

