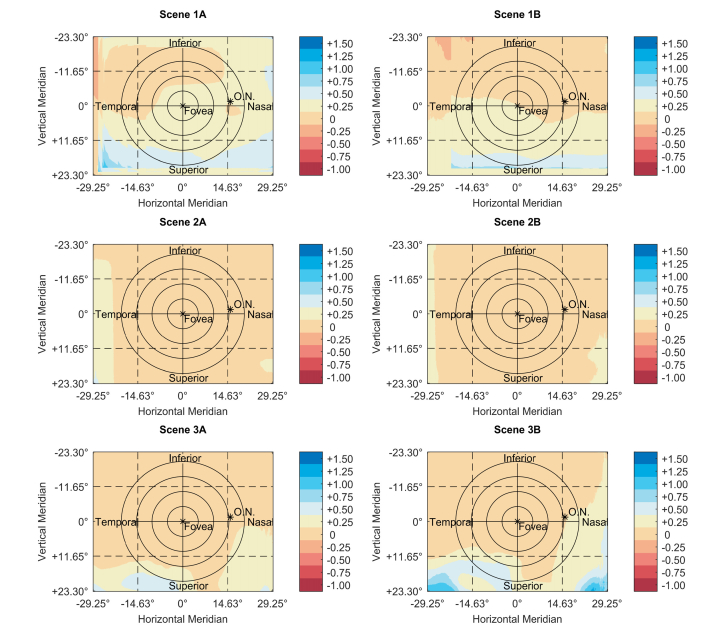
Fig. 7.
Dioptric defocus maps of the subject’s right eye along with scale bars (diopters) and grids with degrees for better understanding of the spatial distribution over the eye. The colour maps are based on the ones proposed by Light and Bartlein [26]. In addition, the position of the optic nerve (O.N.) is sketched according to literature-based approximations [27]. Concentric circles are marked as a reference around the fovea in steps of 5°.

