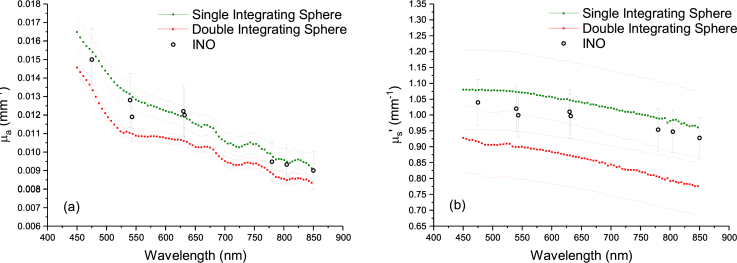
Fig. 7.
Measurements from λ = 450 nm to 850 nm of (a) the absorption coefficient μa and (b) the reduced scattering coefficient of a B0430 sample (nominal thickness t = 5 mm) using a single integrating sphere setup and a double integrating sphere setup [16]. Continuous lines are used to represent the upper and lower bounds of the uncertainties on the results. The results are compared to measurements by INO at λ = (475, 540, 543, 630, 632, 780, 805 and 850) nm (uncertainty at k = 2).

