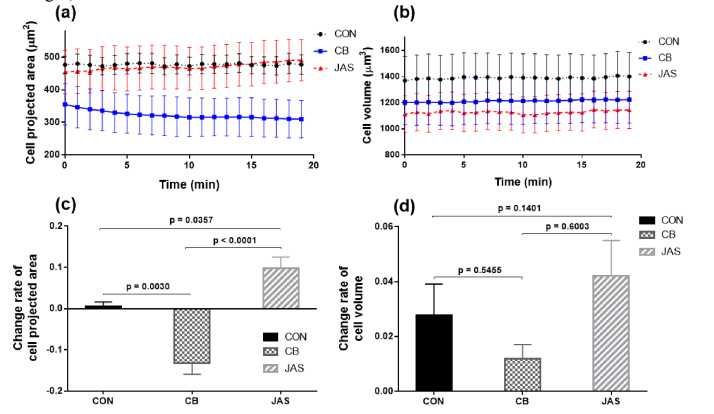
Fig. 7.
Temporal variations of (a) cell projected area and (b) cell volume over 20 min. Black dashed lines with dots represent the CON group, blue solid lines with squares represent the CB group, and red dashed line with triangles represent the JAS group. (c): change rates of cell projected area and (d): change rates of cell volume in the three groups.

