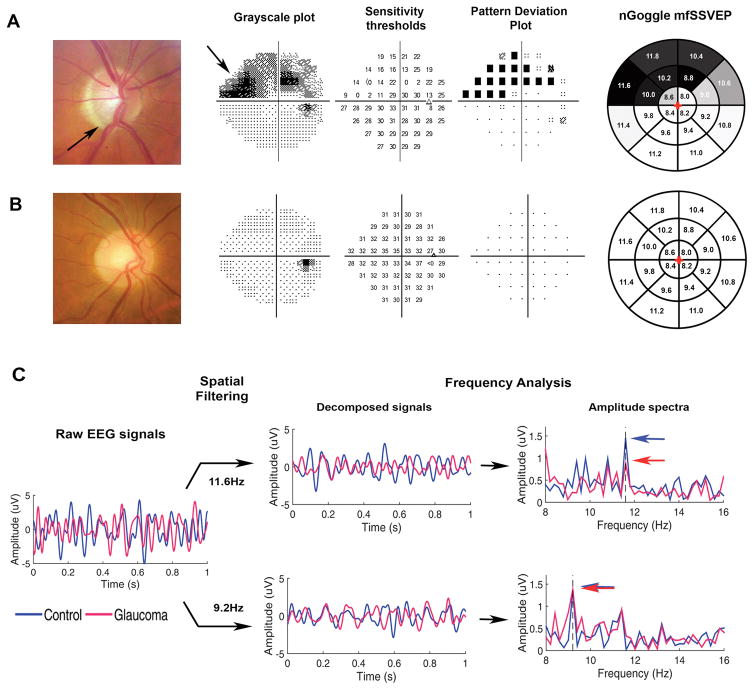
Figure 3. Results from nGoggle and standard perimetry of glaucomatous and healthy eyes included in the study.
A. Eye with glaucoma showing inferior loss of neuroretinal rim (arrow) and superior nasal visual field defect (arrow). B. Optic disc photograph and perimetric results of a healthy eye. C. Multifocal steady-state visual evoked potentials obtained by the nGoggle for the eyes in A (red) and B (blue). The figure illustrates processing for sectors 11.6Hz, located in the superior nasal region of defect; and 9.2Hz, located in the inferior temporal normal region. For the 11.6Hz frequency, the amplitude for the glaucoma eye (red arrow) is much lower than that for the healthy eye (blue arrow). For the 9.2Hz frequency, the amplitudes are almost identical. The final pattern of nGoggle sectoral results are show in greyscale in the rightmost column.

