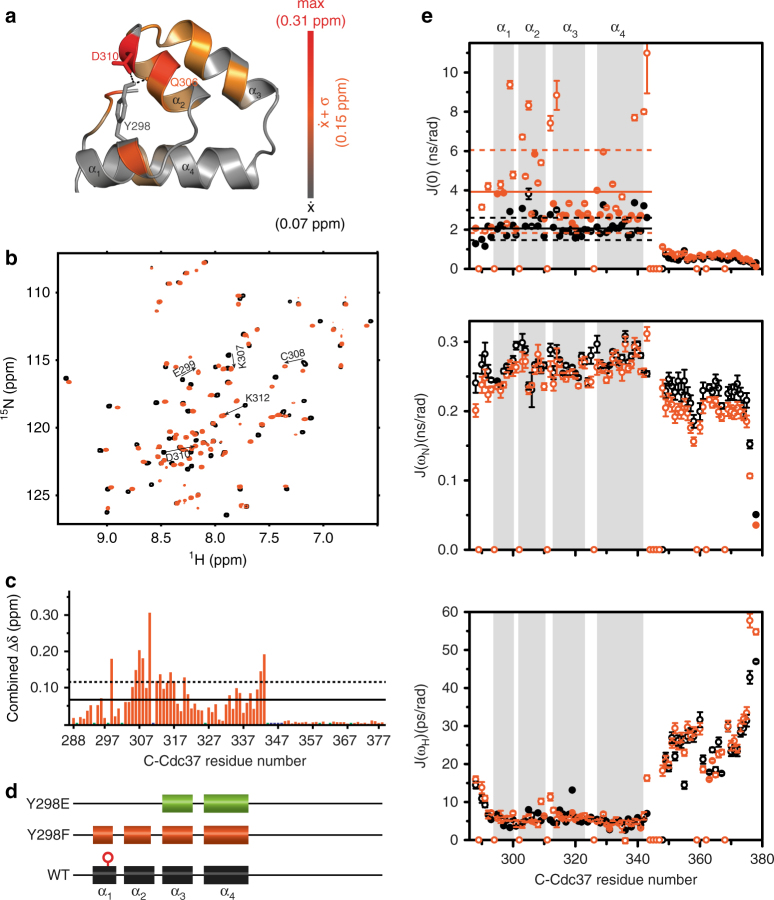
Fig. 1.
Conformational properties of C-Cdc37Y298F. a The hydrogen-bond network of Y298 involving Q306 and D310 is shown as black dashed lines on the solution structure of C-Cdc37. C-Cdc37 is colored with a gray-to-red gradient, according to the observed chemical shift perturbation between the wild-type and Y298F C-Cdc37. b Overlay of the 15N-HSQC of Y298F (orange) and wild-type C-Cdc37 (black) with the tryptophan indole region omitted. c Magnitude of CSP between wild-type and C-Cdc37Y298F. Prolines are shown as green bars and unassigned residues as blue bars. CSPs higher than the mean or one standard deviation above the mean are marked with solid and dashed lines, respectively. d Chemical shift-derived secondary structure for wild-type (black), Y298F (orange), and Y298E (green) C-Cdc37. e Reduced spectral density functions J(0) (top), J(ωN) (middle), and J(0.87ωH) (bottom) of Y298F (orange) and wild-type Cdc37 (black). Solid and dashed lines mark the mean and the mean ± one standard deviation of the spectral density functions across the C-Cdc37 sequence

