Fig. 3.

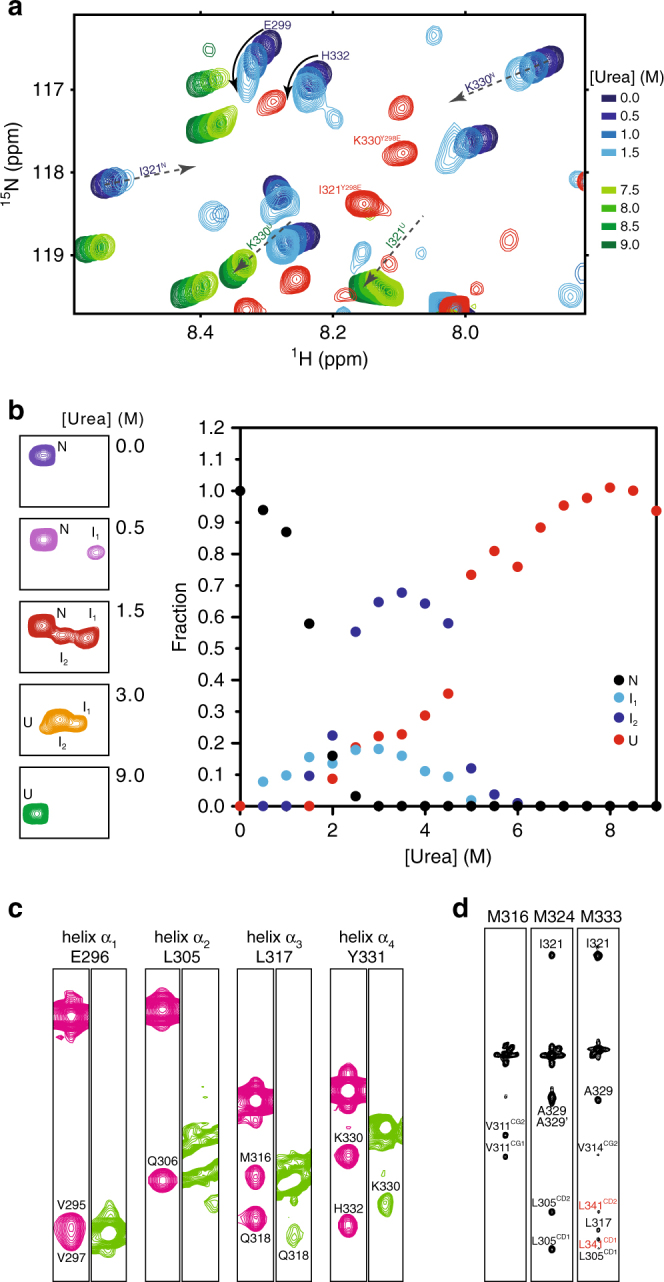
Phosphorylated C-Cdc37 populates folding intermediates. a The beginning (0.0–1.5 M urea) and end (7.5–9.0 M urea) of the equilibrium unfolding of C-Cdc37 monitored by 15N-HSQC. Arrows track the shift of signals from the native to the unfolded state. For I321 and K330 for which the signals of both the native and unfolded states are visible in this expansion, the superscripts N and U on the assignment denote native and unfolded states, respectively. For E299 and H332, the signals of the unfolded state fall outside the present spectral window, but show a “curved” change in chemical shift with increasing urea concentration. The spectrum of C-Cdc37Y298E is shown in red for comparison highlighting the position of I321 and K330 signals. b The indole H–N region of wild-type C-Cdc37, highlighting the signals that correspond to W342 at different points of the equilibrium unfolding (left). Fractional populations of the four visible species populated by C-Cdc37 during the equilibrium unfolding as a function of urea concentration (right). c Selected strips from the amide region of the 15N-NOESY-HSQC recorded for the wild-type C-Cdc37 (pink) and C-Cdc37Y298E (green). Representative residues from all helices α1–α4 are included. d Selected strips from the HMQC–NOESY–HMQC spectrum of C-Cdc37Y298E, highlighting unambiguous (black) and tentative (red) NOEs
