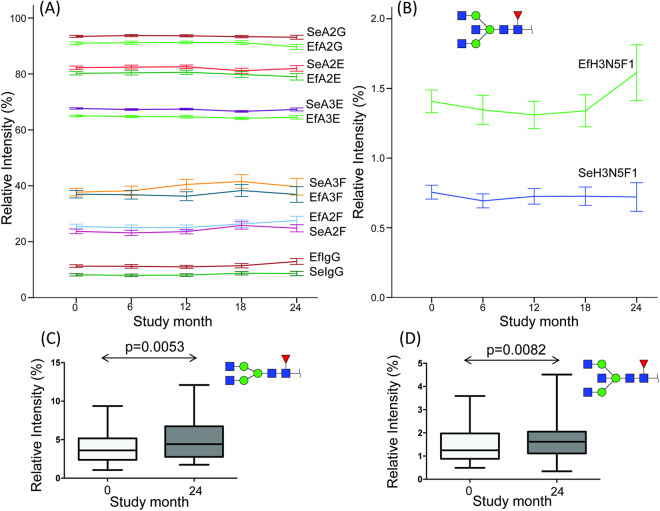
Figure 3.
Selected N-glycan traits from serum (Se) and effluent (Ef) over time. (A and B) Mean ± SE values of all patients over time classes as defined in Table 1. (A) At baseline (study month 0) all p-values were below the Bonferroni-adjusted significance threshold α = 0.0042 in paired Wilcoxon signed-rank tests for serum vs. effluent for A2G, A2E, A3E, A2F, IgG-related traits (N = 85 each); A3F was not significantly different at baseline. (C and D) Min/Max-values and boxplots with p-values from a paired Wilcoxon signed-rank test (two-tailed) for IgG-related direct traits in effluent samples from 24 patients at baseline vs. 24 months.

