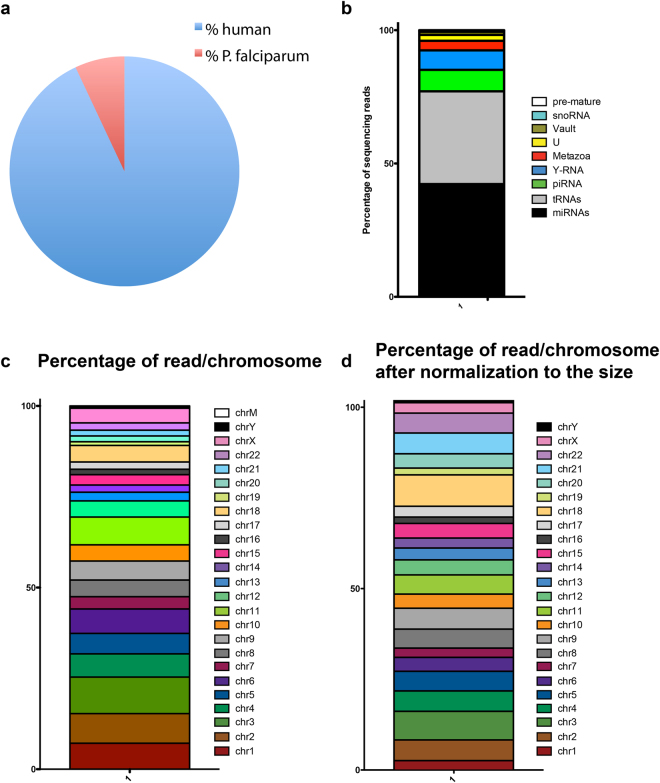
Figure 2.
Characterization of small RNAs by NGS. (a) Composition of reads mapping to human and P. falciparum genomes. (b) Distribution of iRBC EV small RNAs. Segments of the bar indicate the percent of reads attributed to each RNA biotype among all RNA reads that mapped perfectly to known sequences, averaged across 3 biological replicates is shown. (c) Reads aligning to coding genes were mapped back to the human chromosomes and represented as the % reads aligning to each chromosome. (d) Reads aligning to coding genes were mapped back to the human chromosomes and after normalization to the nucleotide size of the chromosome.

