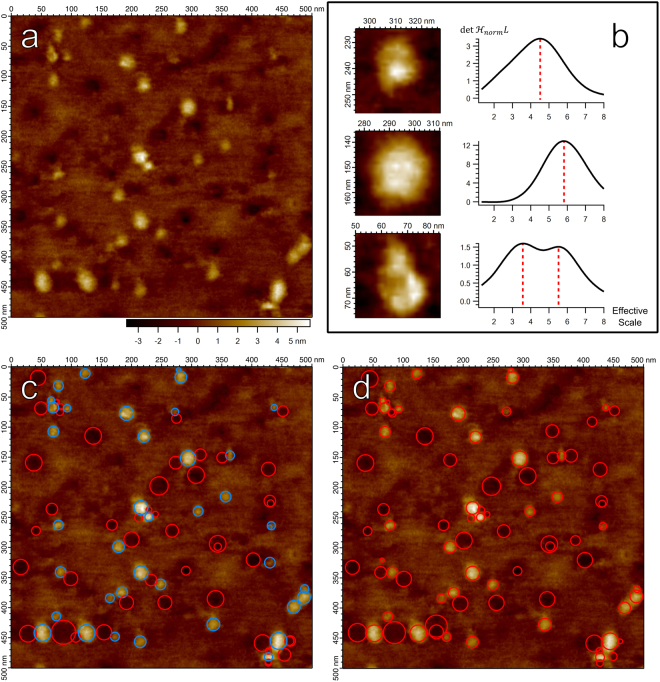
Figure 1.
(a) AFM image of membrane protein SecYEG embedded in a lipid bilayer supported on a glass substrate11. (b) Particles from (a) with increased color contrast, and their corresponding scale-space signature to their right. The response of scaled by a factor of 1 × 10¹⁹ was calculated at the central pixel in each particle and plotted as a function of the effective scale44 approximated as . Top Row: A smaller particle and the corresponding scale extracted from the scale-space signature, marked by red dashed line. Middle Row: A larger particle, with a detected scale greater than the top particle. Bottom Row: A complex particle with substructure components. Two scales are identified, one corresponding to a smaller substructure component and one for the particle as a whole. (c) The 90 strongest scale-space extrema of , represented as circles centered on the spatial coordinates of the scale-space extremum with radius . As in the style used by Lindeberg29, red circles represent maxima (dark blobs), blue represent minima (bright blobs). (d) The 90 strongest scale-space maxima of , also as circles with radius . Both positive and negative blobs correspond to maxima of .

