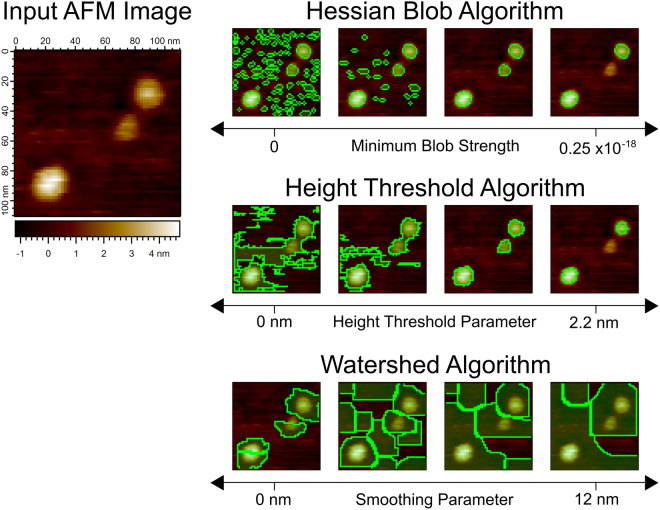
Figure 6.
A comparison of particle detection algorithms as user settings are varied, demonstrated on an image of translocase complexes (SecYEG/SecA) on glass. Top row: Hessian blobs computed at single-pixel resolution. The minimum blob strength begins from zero (considering all bright blobs) and increases to the right. Blob boundaries do not deform. Middle row: Threshold algorithm particles, as the height threshold parameter is varied. Particle boundaries deform to include nearby particles and noise at low thresholds. Bottom row: Watershed algorithm particles, as the width σ of the discrete Gaussian smoothing kernel is varied, where a 110 pixel minimum was required for every particle. Boundaries expand without limit as the smoothing level increases.

