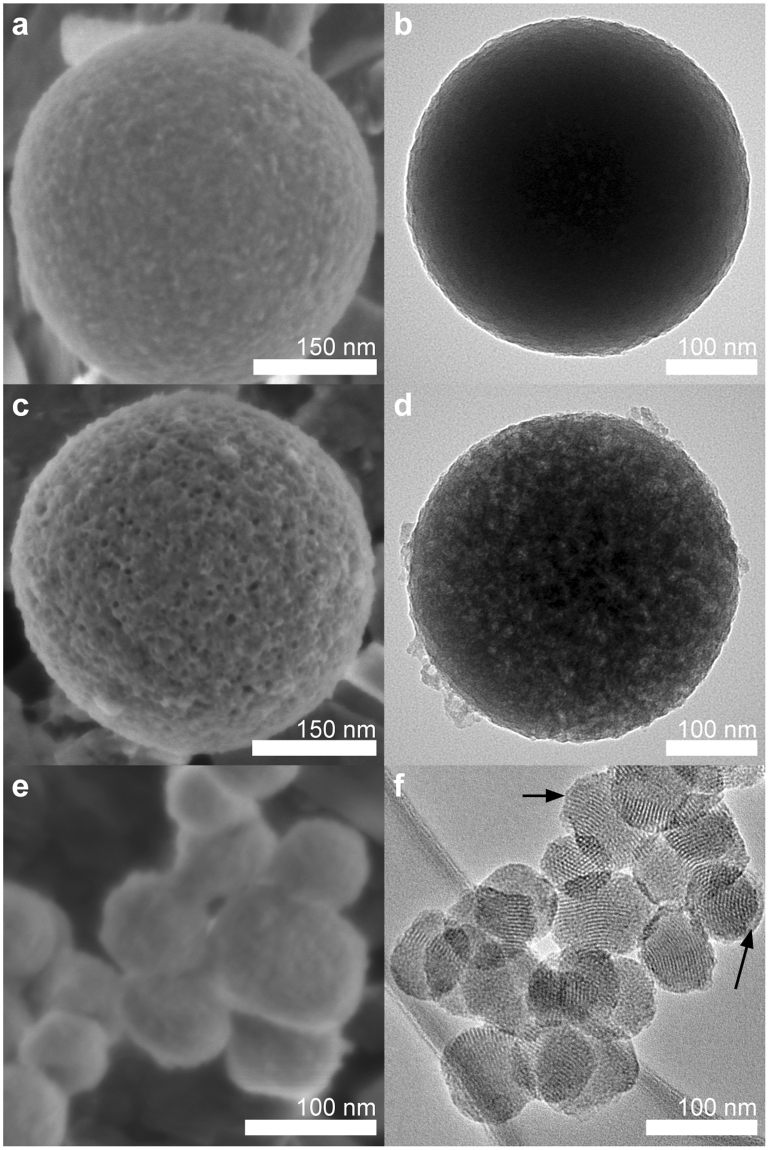
Figure 2.
Microscopy of OCT-MSNs and control particles contrast the results of drug-templating and diffusion gradient drug loading. SEM and TEM micrographs of drug-templated MSNs before drug release (a and b, respectively) show well defined and separated particles approximately 424 nm in diameter. Post-drug-release OCT-MSNs (SEM in c, TEM in d) show very clear surface pore openings and well resolved pores throughout the particle. Control OCT-loaded MCM-41 (SEM in e, TEM in f) exhibits fusing of particles and a layer of external drug (highlighted with arrows).

