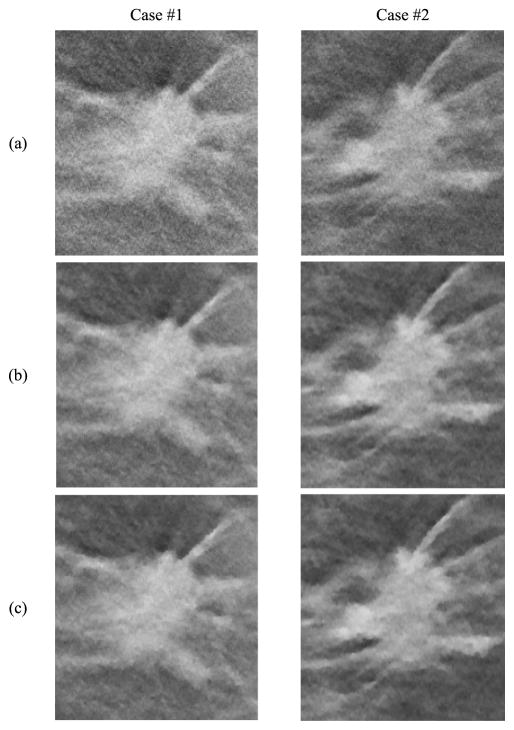
Fig. 4.
Comparison of reconstruction methods and parameters using human subject DBTs with invasive ductal carcinomas. Row (a) SART, (b) SQS-DBCN, β = 70, δ = 0.002/mm, (c) SQS-DBCN, β = 100, δ = 0.001/mm. All image patches shown are 180 × 200 pixels in size. The CNR of the MCs increases from (a) to (c). However, the spiculations and the tissue textures become more patchy and artificial in (c). All images are displayed with the same window width setting.

