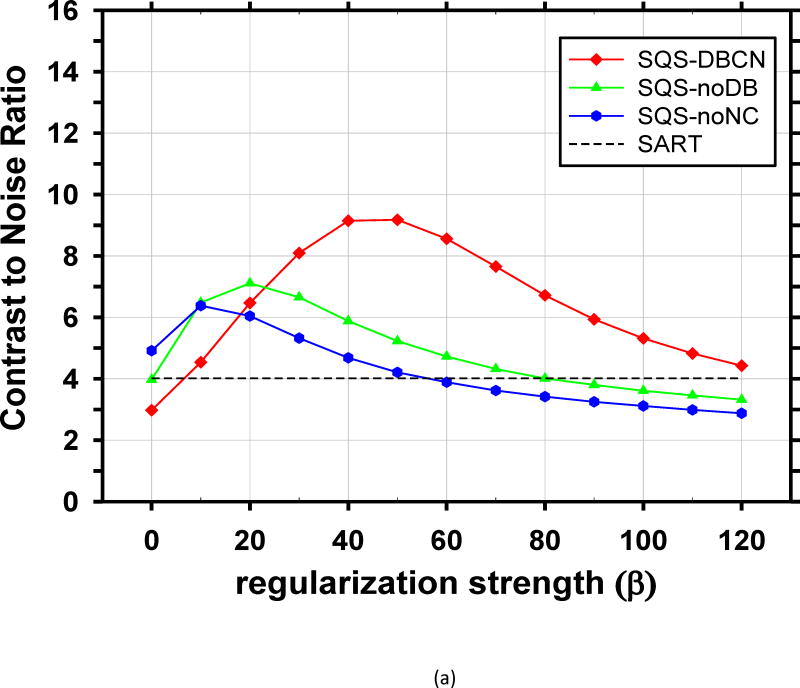
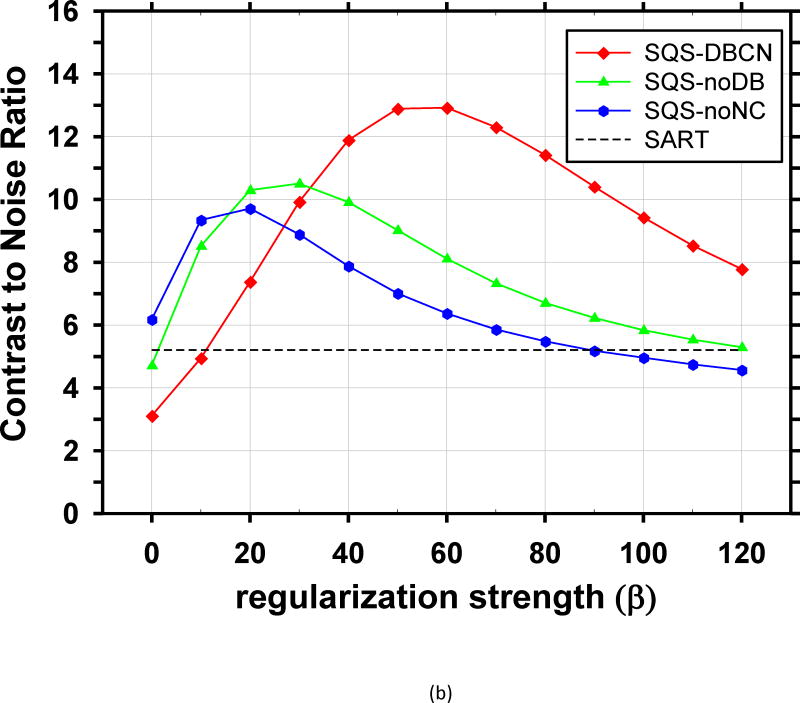
Fig. 5.
Comparison of reconstruction with different model components. CNR is plotted as a function of β at δ = 0.002/mm. (a) MCs of nominal size 0.15–0.18mm, (b) MCs of nominal size 0.18–0.25mm. The SQS-DBCN method yields MCs with higher CNR compared with the SQS-noDB or the SQS-noNC reconstruction over a wide range of β values.


