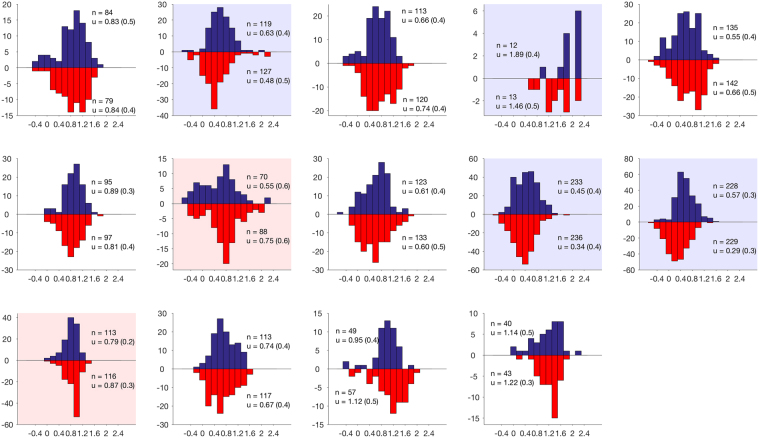
Figure 2.
Individual level distributions for the frequency of percept (y-axis) versus log duration of percept (x-axis). Percept durations are presented logged to account for significant inter-subject variability, normalising the data. Duration histograms are shown for both percepts on the same plot. Perceived gallop rhythm identified by red bars and segregated by blue. Significant within-subject effects are shown by colouring the background for the longer duration percept (red for gallop, blue for segregated). n# refers to the number of perceptual switches and μ refers to the mean (standard deviation).

