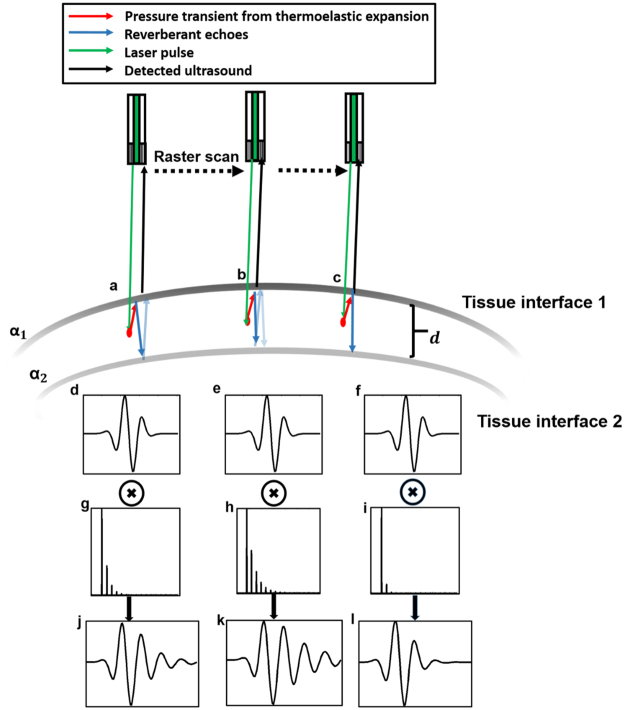
Figure 1.
Schematic showing photoacoustic signals detected with different reverberation responses at 3 points (a–c) during a raster scan. (d–f) Transducer impulse response. (g–i) Reverberation responses. (j–l) Detected photoacoustic signals. ⨷ Denotes the convolution operator. The reverberant echoes are denoted with lighter arrows to indicate reducing intensity. α1, α2 denote the respective echogenicity of the two tissue interfaces separated by d.

