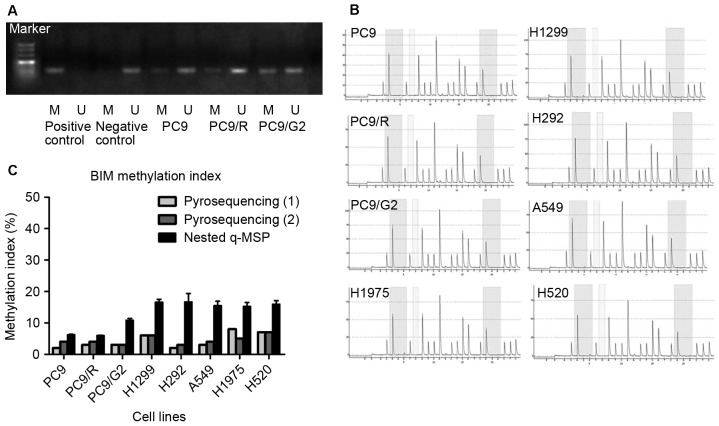
Figure 1.
BIM promoter methylation analysis. (A) MSP analysis of the BIM promoter in the PC9 cell lines. PC9 and its two derivative, gefitinib resistant cell lines all presented with hypo-methylated BIM. (B) Pyrosequencing analysis of all studied cell lines. Blue regions mark the analyzed positions. (C) Comparison of the BIM methylation index by pyrosequencing and nested q-MSP in all studied cell lines. BIM, bcl-2-like protein 11; MSP, methylation specific polymerase chain reaction; q-, quantitative; M, methylated; U, unmethylated.

