Figure 2.
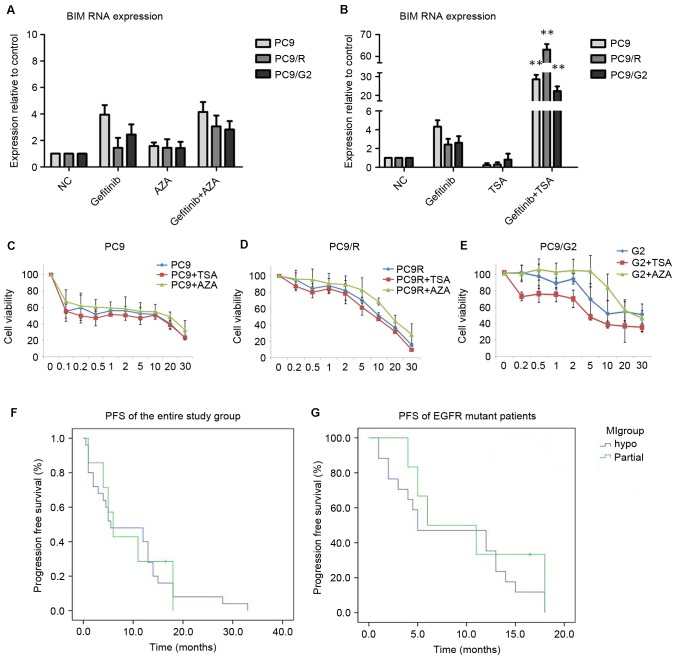
In vitro assays. BIM gene expression levels in PC-9 cell lines following (A) AZA or (B) TSA treatments. Analysis of (C) PC9, (D) PC9/R and (E) PC9/G2 cell viability, following pre-treatments with TSA or AZA prior to gefitinib treatment. Cells pre-treated with TSA demonstrated lower tolerance to gefitinib compared with those that received gefitinib treatment alone. AZA pre-treatment, however, resulted in higher cell line resistance. Progression free survival curves of (F) the entire study group and (G) EGFR mutant groups. **P<0.01 vs. cells treated with DMSO and gefitinib. BIM, bcl-2-like protein 11; AZA, 5-Aza-2′-deoxycytidine; TSA, Trichostatin A; EGFR, epidermal growth factor receptor; PFS, progression free survival; NC, negative control.

