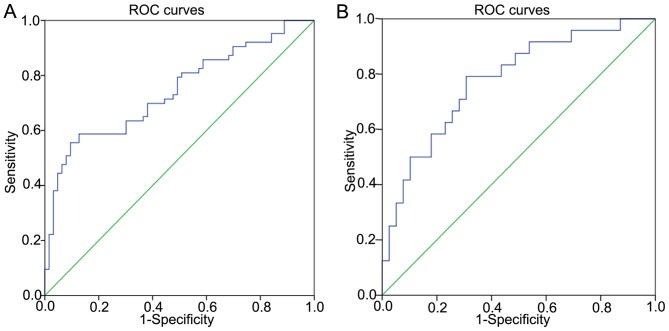
Figure 2.
ROC curves demonstrating the diagnostic value of miR-144. (A) Diagnostic value for differentiating between PTC and non-cancerous tissues (AUC, 0.743; 95% CI, 0.657–0.829; P<0.001). The sensitivity was 58.7%, and the specificity was 87.3%. (B) Diagnostic value of miR-144 for whether the tumor sizes ≥2 cm (AUC; 0.779; 95% CI, 0.661–0.896; P<0.001). The sensitivity was 79.2%, and specificity was 69.2%. ROC, receiver operating characteristic; PTC, papillary thyroid carcinoma; AUC, area under the curve.

