
Figure 4.
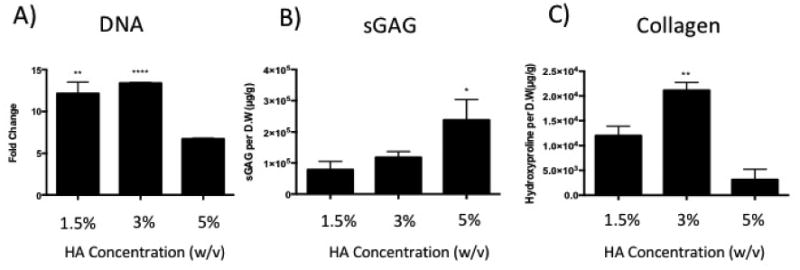
Effects of varying HA concentration in 3D ELP-HA hydrogels on chondrocyte proliferation and cartilage matrix production. Quantification of (A) DNA content, (B) sulfated-glycosaminoglycan (sGAG) content, and (C) total collagen content. Data are presented as mean +/- standard deviation (n = 3 per group). **p<0.005; ****p <0.0001 compared with ELP-5% HA group in A) *p<0.05; **p<0.005 compared with ELP-1.5% HA group in B) and C).