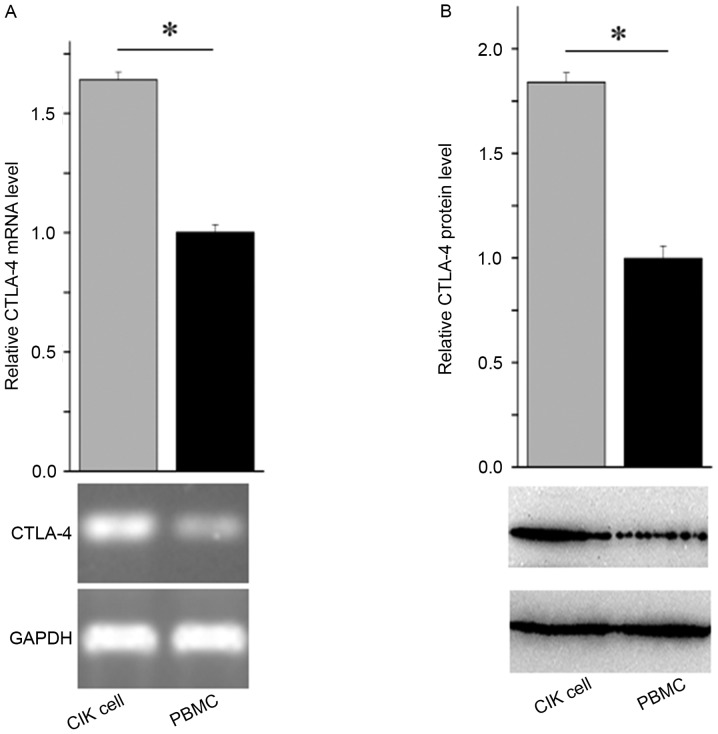
Figure 1.
CTLA-4 expression was higher in CIK cells than in PBMCs. (A) The CTLA-4 mRNA expression in PBMC or CIK cells. *P<0.05. Top panel, qPCR analysis of CLTA-4 mRNA expression in PBMCs and CIK cells. CTLA-4 mRNA expression levels were normalized to GAPDH. CLTA-4 mRNA expression level in CIK cells was normalized to 1 for PBMCs. Bottom panel, agarose gel images indicating the mRNA expression of CTLA-4 and GAPDH in PBMCs and CIK cells. (B) The CTLA-4 protein expression in PBMC or CIK cells. *P<0.01. Top panel, western blot analysis of CLTA-4 protein expression in PBMCs and CIK cells. CTLA-4 protein expression levels were normalized to GAPDH. CLTA-4 protein expression level in CIK cells was normalized to 1 for PBMCs. Bottom panel, representative images indicating the protein expression of CTLA-4 and GAPDH in PBMCs and CIK cells. All the data presented are mean values from three independent experiments and plotted as the mean ± standard error of the mean. CTLA-4, cytotoxic T lymphocyte-associated antigen 4; CIK, cytokine-induced killer; PMBC, peripheral blood mononuclear cells; qPCR, quantitative polymerase chain reaction.

