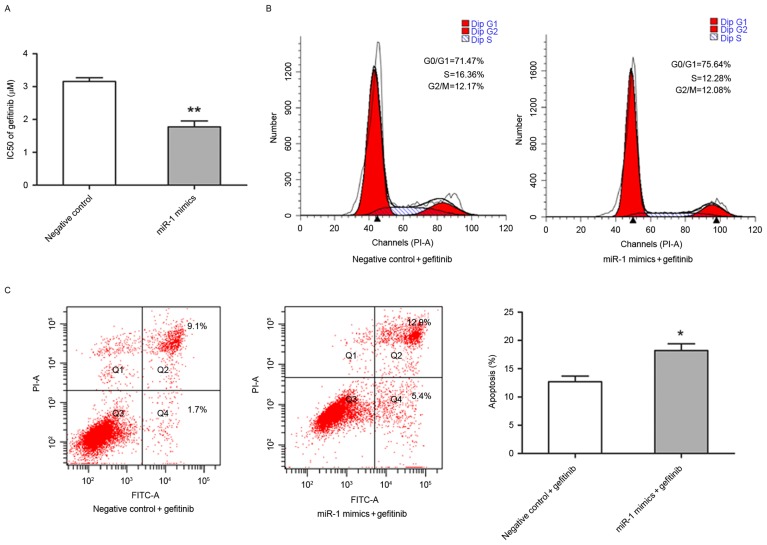
Figure 4.
Exogenous expression of miR-1 enhanced sensitivity to gefitinib in TE-1 cells. TE-1 cells were transiently transfected with miR-1 mimics (50 nM) or the negative control. (A) The cells following transfection were treated with various concentrations of gefitinib (0, 0.01, 0.1, 1 or 10 µM) for 48 h, and the IC50 for gefitinib were calculated by cell counting kit-8 assay. (B) The cells following transfection were treated with gefitinib (3 µM) for 24 h and were harvested for cell cycle analysis by flow cytometry. (C) The cells following transfection were treated with gefitinib (3 µM) for 24 h and were harvested for apoptosis analysis by flow cytometry. Data are presented as the mean ± standard error from three independent experiments. **P<0.01 vs. negative control; *P<0.05 vs. negative control plus gefitinib. IC50, half-maximal inhibitory concentrations; miR, microRNA; FITC, fluorescein isothiocyanate; PI, propidium iodide.

