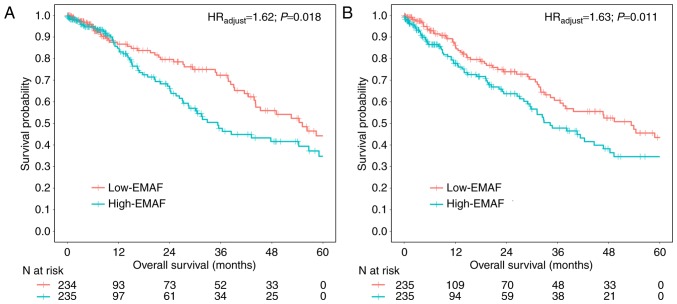
Figure 2.
EMAF and NSCLC patients' overall survival. Survival curves for the discovery set (A) and replication set (B) cases, which were divided into low-EMAF (red) and high-EMAF (blue) groups by the median value. Hazard ratios (HRadjust) and P-values were estimated by Cox regression with adjustment for age, gender, smoking status, clinical stage, T classification, N classification and histology type l.

