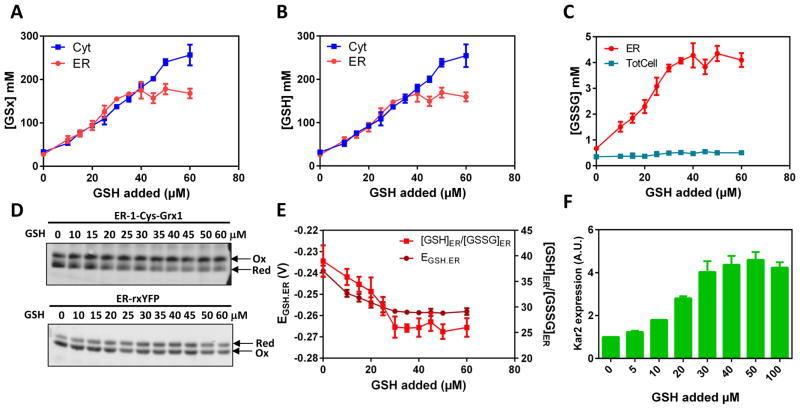
Figure 1. Inhibitable facilitated diffusion of GSH across the ER membrane.
Corrected cytosolic (Cyt) (TotCell x 4.5), total cellular (TotCell) and ER (ER) levels of (A) [GSx] = [GSH] + 2[GSSG], (B) reduced [GSH] and (C) oxidized [GSSG] in mM, as indicated, measured in HGT1 cells incubated 1 h with the indicated amount of GSH. (D) Non-reducing SDS-PAGE migration of ER-1-Cys-Grx1 (upper panel) and ER-rxYFP (lower panel) from lysates of HGT1 cells incubated with indicated amount of GSH for 1h, representative of those used to derive the data in E. (E) The ER glutathione redox potential (EGSH.ER), and ER ratio of GSH/GSSG values used to derive the data in A–C. (F) KAR2 expression measured by quantitative PCR in HGT1 cells incubated 1 h with the indicated amount of GSH. Values are the mean of three independent biological replicas ± standard deviation (s.d.).

