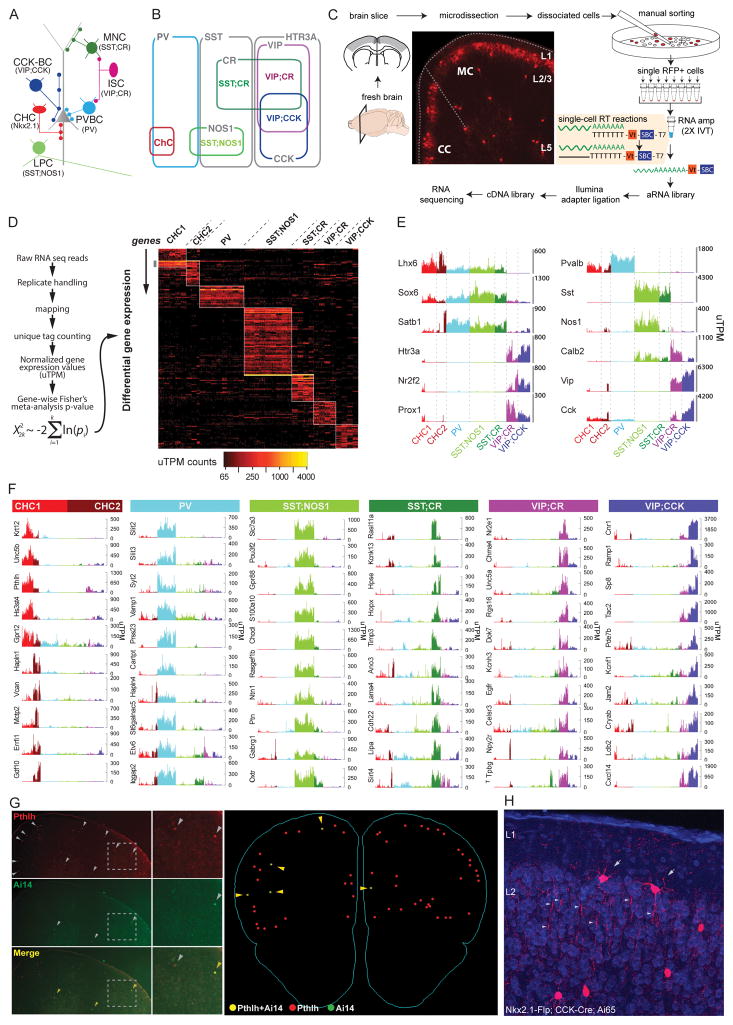
Figure 1. Transcriptomic analysis of GABAergic PCPs.
(A) Schematic of 6 PCPs with characteristic innervation patterns.
(B) Molecular markers parsing cortical GABA neurons into 3 non-overlapping populations and 6 PCPs.
(C) Experimental workflow.
(D) Bioinformatics pipeline (left) and DE genes across PCPs (right).
(E) Validation of known PCP markers; uTPM: unique transcripts per million.
(F) Novel PCP markers.
(G) Pthlh mRNA (grey arrowheads) co-localizes with RFP-labeled CHCs (yellow arrowheads) shown by FISH (left). Serial 3D reconstruction shows >95% RFP cells are Pthlh+ (right).
(H) Cck+ CHCs labeled in Nkx2.1-Flp;CCK-Cre;Ai65 cortex. Red: RFP; blue: DAPI; arrow: CHC; arrowhead: CHC axon boutons.

