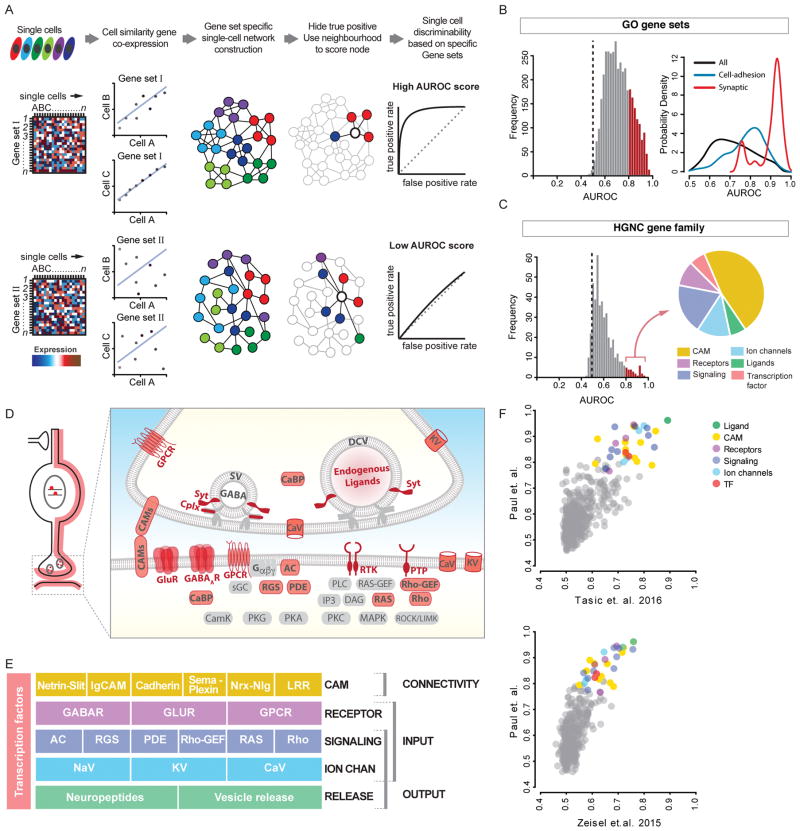
Figure 2. Gene families and categories that distinguish PCPs.
(A) MetaNeighbor schematic. scRNAseq values for gene sets are used to construct cell networks such that cells similar in gene expression space are close neighbors (connected by lines). PCP identity labels (colors) are then withheld and its identity inferred based on connectivity to immediate neighbors. The probability of being identified as the correct PCP is reported as AUROC score (0.5 is at chance).
(B) Left: AUROC value distribution of ~3800 GO terms. Red: AUROC>0.8. Right: GO-term probability density by keyword; “synaptic” and “cell-adhesion” are skewed with AUROC>0.8.
(C) AUROC distribution of 442 HGNC gene families. ~40 families (red bars) in 6 categories (pie chart) are highly predictive of PCP identities (AUROC≥0.8).
(D) Schematic showing that high-performance gene families (except TFs) encode proteins that primarily localize along cell and synaptic membrane.
(E) High-performance gene families constitute 5 layers of functional categories that organize synaptic connectivity and input-output signaling.
(F) MetaNeighbor analysis of two independent scRNAseq datasets yields similar rank order of gene families.
Also see Tables S2, S3, S4, S5 & S7; gene name abbreviations in Methods.

